8 Chromatograph operating conditions
8.1 General
The operating conditions given below have been found to be adequate but they should be optimized with each GC system so that gas chromatograms similar to the one shown in Annex A can be obtained from dilutions of the test mixture in 5.5. Using hydrogen as carrier gas, a satisfactory separation will be obtained in 30 - 40 min (Figure A.1). With helium carrier gas, the separation will take longer, 55 - 60 min.
8.2 Injectors
Set up the injector according to the manufacturer's instructions. Typical settings for this analysis are as follows:
Split/splitless injector
Splitless mode: T = 240 °C to 280 °C
Split mode: T = 250 °C to 280 °C, split ratio = 5 : 1 to 50 : 1
On-column injector: T = 50 °C to 110 °C according to the solvent used.
8.3 Oven temperature program

8.4 Carrier gas flow rate
Adjust inlet pressure to give a flow rate through the column of 1 ml/min at 130 °C, e.g. 270 kPa for He.
NOTE Hydrogen carrier gas is effective in reducing column pressure head and analysis time.
8.5 Electron capture detector (ECD) settings
Temperature: 300 °C to 350 °C.
Electrical control: use manufacturer's recommended settings to give the best conditions for linearity of the detector.
Make-up gas, flow rate: 20 ml/min to 50 ml/min, according to manufacturer's recommendations.
9 Data-processing system
The system should be prepared in readiness for the start according to the manufacturer's instructions.
Most systems require designation of a minimum of two reference points including the internal standard DCB.
9.1 Data files
The method requires data files containing experimental data (ERRT) and data originating from the literature. For each peak of single or coeluting congeners the following data is filed in order of increasing ERRT (see Table A.1):
experimental relative retention time (ERRT);
congener numbers;
relative response factors (RRFs).
Two sets of RRFs based on data originating from [4] are provided in Table A.1. A weighted average response factor was calculated for each peak containing coeluting congeners using the relative proportions of the congeners found in commercial mixtures using data from [5], [6] and [7].
"All probable"
Some congeners have never been observed in commercial PCB mixtures. So, in those cases where more than one congener co-elutes under one chromatogram peak, the RRF of the group of congeners is weighted by exclusion of congeners not found in commercial mixtures. Use this data set with unknowns and mixtures of commercial products.
"All possible"
This class includes all 209 PCB congeners. This data set is included for use with dechlorinated materials.
Table A.1 shows that where there is no co-elution (for example peak n° 48) the RRF of each set has the same value and where there is co-elution (for example peak n° 49) there are different values for the different sets.
RRFs in Table A.1 are corrected for the instrument being used by the calibration procedure in clause 11.
9.2 Co-eluting congeners
More than one congener may co-elute under a single peak, the programme should group peaks together if they fall within the window of +/- 0,0015 from the RRT. See Table A.2 for individual congener RRTs and elution order.
10 Checks of instrumental performance
When initially implementing this method and after major repairs and replacement of critical instrumentation components (specifically EC detector and GC column), each laboratory that uses this method shall operate a performance control programme. This should include verification of sensitivity, resolution and linearity range. It is recommended to monitor the performance routinely at appropriate time intervals.
10.1 Sensitivity check
The ECD shall have sufficient sensitivity to give a signal-to-noise ratio (S/N) greater than 20 for one picogram of hexachlorobenzene injected into the column.
10.2 Linearity check
The response of the electron capture detector is proportional to the quantity of PCBs injected only within a limited range; if the quantities of PCBs passing through the detector become excessive, the response will cease to be linear. Determine the linear range as follows:
10.2.1 Use the stock solution of selected PCB congeners (5.6). Dilute the solution with solvent (5.1.1) containing 100 mg/ml of insulating liquid (5.1.3) in suitable steps e.g. 1, 2, 5, 20, 50, 100 dilution. Submit 500 4l of each solution to the clean-up procedure (11.1.3) and add 10 4l of C30 solution (5.1.4) to the 5 ml collecting flask before making up to the mark with solvent. The final dilutions are now, e.g. 10, 20, 50, 200, 500, 1 000. Each solution contains 20 ng/ml C30 and the eluate from 10 mg/ml insulating liquid. Inject a suitable quantity (the same each time) into the GC according to the injection system using the chromatographic conditions in clause 8.
10.2.2 The use of congeners 31, 118 and 180 that are present in major proportions in commercial mixtures plus the internal standard C209 (DCB) is recommended.
Measure the peak area or height (Rj) for the specified congeners 31, 118, 180 and 209 and calculate the concentration (Bj) of each congener in ng/ml for each dilution.
Use the area or height of the C30 peak to check that the correct volume has been injected. The area/height of the C30 peak for the series of injections shall not vary by more than +/- 5 % of the average for that series of injections. Tests that fall outside of this range shall be repeated.
Calculate the sensitivity factor Sj for each congener and each dilution:

10.2.3 The linearity plot is a line through the data points (Figure 1). This line must be within 5 % of the constant value obtained by a least square fit. The upper limit of the linear range is the point where the plot crosses the - 5 % envelope and the lower limit level is where the line crosses the + 5 % envelope. The linear range of the detector is defined in Figure 1.
10.2.4 Relating the linear range of the ECD to amounts of commercial mixtures. The maximum amounts of commercial mixture that may be injected to ensure they fall within the linear range of the detector may be calculated from the respective congener (see Table 1).
10.3 Resolution check
Treat 500 μl of solution (5.5) as per 11.1.3. Using optimised chromatographic parameters, inject a suitable aliquot in the linear range of the ECD.
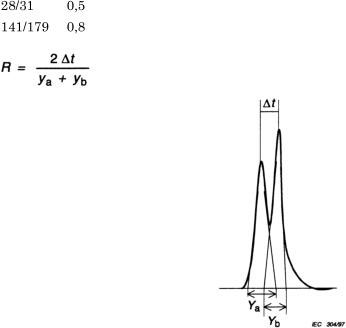
Calculate the resolution (R) for the pairs of congeners C28/C31 and C141/C179 (identified as in Figure A.1).
Resolution R is expressed as the ratio of the distance between the maxima of the peaks to the average of their peaks width at the base using the formula:

The resolution shall be at least:

Providing the resolution is satisfactory, this chromatogram can be used for the determination of ERRTs (11.4).

