13. Procedure
13.1 Gas Chromatographic Analysis - Set the data acquisition system in a mode that provides continuous integration of the detector signal and storage ofthe integral as area slices. The data acquisition rate should be between 2 Hz to 5 Hz so that the slice width is 0.5 s to 0.2 s, respectively, and remains fixed throughout the analysis. Program the column to the maximum temperature to be used and perform the gas chromatographic analysis by following the sequence described below.
13.1.1 Cool the column oven to the starting temperature and allow it to equilibrate for a defined period of time (at least 2 min).
13.1.2 Inject an appropriate volume (0.1 µL to 0.5 µL) of the sample into the inlet of the gas chromatograph and immediately begin the temperature program. The data acquisition system shall start recording data immediately upon sample injection and, therefore, must be synchronized with the injection. Continue acquiring data until the temperature program cycle is completed and the oven begins to cool.
13.1.3 For each additional analysis, repeat 13.1.1 and 13.1.2.
13.2 Sequence Protocol - A recommended sequence of analyses follows. The same run conditions should be used for each sequence event.
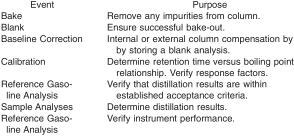
13.2.1 Calibration should be performed weekly when the instrument is in use, or whenever maintenance is performed and as dictated by the lab on-site precision and/or quality control protocol.
NOTE 2 - If automatic baseline correction is provided by the gas chromatograph, further correction of area slices may not be required. However, if an electronic offset is added to the signal after baseline compensation, additional area slice correction may be required in the form of offset subtraction. Consult the specific instrumentation instructions to determine if an offset is applied to the signal. If the algorithm used is unclear, the slice area data can be examined to determine if further correction is necessary. Determine if any offset has been added to the compensated signal by examining the corrected area slices of those time slices that precede the elution of any chromatographic unretained substance. If these corrected area slices (representing the true baseline) deviate from zero, subtract the average of these corrected area slices from each corrected area slice in the analysis.
14. Calculations
14.1 Offset Correction - Create a sample chromatogram table consisting of the area slices and associated slice times in chronological order. Correct area slices for electronic offset as follows:
14.1.1 Throw out any of the first five area slices that are not within one standard deviation of the average and recalculate the average. This eliminates any area that is due to possible baseline upset from injection.
14.1.2 Subtract the recalculated average from every slice in the table and replace the original area slice with this offset-corrected area slice. Set any negative values to zero. If the sample chromatogram was obtained with a valid, instrument-compensated baseline (see Note 2), do not perform the baseline subtraction described in 14.2.
14.2 Reference Baseline Subtraction - Create a reference baseline table consisting of the area slices and associated slice times from the blank baseline run. Verify that the slice width used to acquire the area slices of the sample chromatogram is the same as was used to acquire the area slices of the reference baseline chromatogram.
14.2.1 Correct area slices in the reference baseline table for electronic offset as directed in 14.1.
14.2.2 Subtract from each offset-corrected area slice in the sample chromatogram table the corresponding offset-corrected area slice in the reference baseline chromatogram table. Replace each entry in the sample chromatogram table with the baseline corrected value.
14.2.3 If, in the previous step, there are negative slices, set them to zero.
14.2.4 Determine the total corrected area by summing all baseline-corrected area slices in the chromatogram.
NOTE 3 - See Appendix X1 for the recommended calculation algorithms for 14.3 and 14.4.
14.3 Start of Sample Determination - Using the baseline-corrected area slices of the sample chromatogram (14.2), determine the time at which the chromatogram first begins to deviate from the baseline.
14.4 End of Sample Determination - Using the baseline-corrected area slices of the sample chromatogram (14.2), determine the time at which the sample has been completely eluted and the detector signal has returned to baseline (end of sample).
14.5 Conversion ofArea to Volume Percent - Determine the volume percent represented by each area slice through the time corresponding to the end of sample as follows:
14.5.1 Convert each corrected area slice to a volume count by multiplying by the appropriate assigned volume response factor. Use the response factor assigned to the calibration component whose retention time is closest to the slice time, as described in Appendix X3. In reformulated gasoline, the oxygenate is typically much higher in concentration than corresponding hydrocarbons that elute near the same retention time (specifically in the case of ethanol). Therefore, when an oxygenate is present, the oxygenate response factor shall be used for that time slice, even if hydrocarbons are coeluting.
14.5.2 Determine the total volume count by summing the volume counts from beginning ofrun to the time corresponding to the end of sample. Calculate volume percent (to the nearest 0.01 %) by dividing each individual volume count by the total volume count and multiplying by 100.
14.5.3 For each slice time, determine the cumulative volume percent eluted by totaling the volume percent for all slices through that time.
14.6 Conversion of Slice Times to Boiling Points - Determine the boiling temperature (to the nearest 0.5 °C or 1 °F) equivalent to each slice time using linear interpolation between adjacent calibration components as directed in X2.1. The resultant table of cumulative volume percents versus boiling temperatures comprises the full boiling range distribution of the material analyzed and is used to produce reports in the desired format. Report the results in ºC or ºF.
