12. Determination of Test Results
12.1 This section describes techniques used to evaluate oil performance with respect to oxidation (viscosity increase), wear (camshaft and lifter), piston deposits, ring sticking, and oil consumption.
12.2 Engine Disassembly - Disassemble the engine, according to the following instructions, in preparation for inspection, rating, and measurement:
12.2.1 Plan the disassembly so that the parts to be rated for sticking, deposits, and plugging (pistons and rings) are removed from the engine within 12 h of the completion of the oil level.
12.2.2 Remove the components from the top of the engine in order to gain access to the cylinder bores.
12.2.3 Remove the carbon deposits from the top portion of the cylinder walls, above the top compression ring travel, before removing the pistons from the engine.
12.2.4 Disassemble the remainder of the engine.
12.3 Preparation of Parts for Rating of Sticking, Deposits, and Plugging - Prepare the specified parts for rating according to the following instructions:
12.3.1 Check all piston rings for freedom of movement in the grooves when removing the pistons from the engine. (See 12.4.1 through 12.4.1.1.)
12.3.1.1 Determine which rings are hot-stuck or cold-stuck (see 3.1.12 and 3.1.5, respectively, for definitions of hot-stuck and cold-stuck rings) and record the piston number and ring identification (for example, piston No.3, top ring) for such rings on Form 8 in standardized report form set (see Annex A8). Record the total number of hot-stuck rings on Form 4 in the standardized report form set (see Annex A8).
12.3.2 At time of disassembly, remove all piston rings that are free. Leave any stuck rings (includes pinched rings; see 3.2.8) in place. Apply a rating of 100 % heavy carbon in the groove to any piston groove that cannot be rated, due to the presence of a stuck ring.
12.3.3 If the piston deposits cannot be rated immediately after the pistons are removed from the engine, store the pistons in a desiccator for no longer than 72 h from end of test before rating. Do not wipe the pistons before storing them. (See 12.4.)
12.4 Piston Deposit Ratings - Rate the pistons for piston skirt varnish as well as deposits on the ring lands, under-crown area, and in the ring grooves.
12.4.1 Gently wipe off excess oil from the piston skirts with a soft cloth.
12.4.1.1 Do not apply any chemicals or build-up oil to the pistons prior to rating them for deposits.
12.4.2 Rate each piston top groove, second groove, oil ring groove, second land, and undercrown area (where the horizontal and vertical planes meet) for deposits using ASTM Deposit Rating Manual 20 rating techniques and breakdown methods. Carbon deposit ratings consist of only two levels: Heavy (0.00 merit value) or Light (0.75 merit value).
12.4.2.1 The undercrown area to be rated is defined as the area on the undercrown of the piston that is demarcated by casting lines on the piston itself, which resembles a common adhesive bandage. Rate only the area on the underside of the piston crown. Do not rate any parts of the inside surfaces of the piston skirts as part of the undercrown rating.
12.4.2.2 Report any unusual deposits observed in the comments section of Form 9 in standardized report form set (see Annex A8).
12.4.3 If multiple ratings for deposits are deemed necessary of a given part or parts, consensus rating may be used according to the following:
12.4.3.1 The raters shall be from the laboratory in question; no outside raters may be used unless requested and directed through the Sequence IIIF Surveillance Panel.
12.4.3.2 No averaging of ratings is permitted.
12.4.3.3 Report only one rating value, which is agreed to by the involved raters.
12.4.3.4 All raters of Sequence IIIF engine pistons shall attend an ASTM Light Duty Deposit Rating Workshop every 12 months +/- 30 days and produce data that meet the TMC definitions of Blue, Red, or White for piston deposits. If a rater is unable to meet this requirement, the rater can continue to rate Sequence IIIF pistons after the completion of the workshop for a grace period of 45 days and can follow the procedure described in 12.4.3.5 to generate data that meet the TMC definitions of Blue, Red, or White.
12.4.3.5 A rater who is unable to meet the requirement in 12.4.3.4 can schedule a visit to the TMC to generate data on ASTM Light Duty Deposit Rating Workshop pistons and receive an assessment of rating performance compared to data collected at recent workshops. Visits to the TMC will be scheduled based on availability of parts.
12.4.3.6 The TMC selects a minimum of six pistons from a collection of workshop parts for the rater to rate piston deposits. The TMC provides rating booths and lights, but the rater is responsible for providing any necessary rating aids. The TMC analyzes the data and determine if the requirement in 12.4.3.4 has been met. If the requirement in 12.4.3.4 has not been met, any time remaining in the 45 day grace period is forfeited.
12.4.3.7 A second attempt to generate rating data at the TMC is permitted only after the rater receives training from an experienced industry rater. The experienced industry rater shall verify to the TMC, in writing, that the rater training has taken place. No more than two attempts are permitted between ASTM Light Duty Rating Workshops.
12.4.4 Average each individual piston (thrust side and anti-thrust side) for inclusion in the weighted piston deposit (WPD) results.
12.4.5 Calculate the average of the six oil ring land (land three) ratings and record this as the average oil ring land deposits on Form 8 and on Form 4 in standardized report form set (see Annex A8).
12.4.6 Weighted Piston Deposit Rating (WPD) - This weighted piston rating is comprised of skirt varnish, top groove, second groove, oil ring groove, under-crown, second land, and third land.
12.4.6.1 Calculate the WPD result for each individual piston using the following weighting factors:
12.4.6.2 Calculate the WPD result for each piston by multiplying the rated result for each piston part by the weighting factor in 12.4.6.1 (in decimal form) to determine a weighted rating for that piston part. The WPD result is the sum of the weighted ratings for the individual piston parts.
12.4.6.3 The WPD result for the test is calculated by a simple average of the six individual piston WPD ratings.
12.5 Post-Test Camshaft and Lifter Wear Measurements - Measure the wear of the camshaft lobes and lifters to the nearest 0.001 mm. Refer to Practice E29 for any needed rounding; use the rounding-off method. Proceed according to the following procedure:
12.5.1 Clean the camshaft lobes and lifters with solvent; blow-dry them with clean, dry shop air.
12.5.2 Store the camshaft and lifters in a temperature-controlled room for at least 90 min before making dimensional measurements, to ensure temperature stabilization. The temperature of the post-test measurement room shall be within 3 °C of the temperature of the pre-test measurement room.
12.5.3 Use dimensional measuring equipment accurate to 0.01 mm (0.0004 in.). Before each measurement session, use standards traceable to the National Institute of Standards and Technology (NIST), to ensure measuring equipment accuracy. Include standards having length values within 1.3 mm of the typical lifter and lobe measurements taken. Use the same equipment and standards for post-test measuring as were used for pre-test measuring. If a calibration shift between pre-test and post-test measurements is detected, evaluate the shift to determine its effect on the wear measurements. Record the results of the evaluation and any corrective action taken.
12.5.4 The same person shall measure the camshaft and the lifters used in a given test, if the measurement equipment utilized is operator-sensitive (that is, if the micrometer has operator-determined spindle pressure).
12.5.5 When measuring the camshaft and the lifters, take precautions to prevent any influence of body heat on the measurements.
12.5.6 Measure the maximum dimension of each camshaft lobe, transverse to the camshaft axis. This dimension is at the rear edge of all lobes (lobes are numbered from the front to the rear of the camshaft).
12.5.7 Measure the length of the lifters at the center of the lifter foot.
12.5.8 Calculate the wear for each camshaft lobe and lifter by subtracting the after-test measurement from the before-test measurement.
12.5.8.1 Due to varnish accumulations on camshaft lobes of high wear resistant oils, post-test measurements may indicate a larger numeric value than pre-test measurements. In this situation, the end of test calculation equates to a negative value. All negative values shall be overridden and entered as 0.000 mm wear for all calculations when determining post-test results.
12.5.9 Calculate the cam-plus-lifter wear by adding the values obtained in 12.5.8. Record the results on Form 7, Valve Lifter and Camshaft Wear Results, in standardized report form set (see Annex A8). Store the cam and lifters, the method and length of time for storage are left up to the laboratory.
12.5.10 Determine the maximum, minimum, and average camshaft-lobe, valve-lifter, and cam-plus-lifter wear. Record the values on Form 7 in standardized report form set (see Annex A8).
12.5.11 Calculate the screened average cam-plus-lifter wear by determining which positions in the engine have the maximum and minimum cam-plus-lifter wear results. Exclude these two positions from the calculation and then calculate the screened average cam-plus-lifter wear based on the remaining ten positions in the engine. Record these results on Forms 4 and 7 in the standard report form set (see Annex A8).
12.6 End-of-Test Used Oil Sample Testing - Conduct a cold-cranking simulator test (Test Method D5293) and a mini rotary viscometer test (Test Method D4684) on the end-of-test (EOT) used oil sample with the exceptions that follow.
12.6.1 Run a cold-cranking simulator (CCS) test (Test Method D5293) on the end-of-test (80 h) drain at successively higher temperatures until you obtain a passing result using the table shown in SAE J300. Consider the W-grade corresponding to the temperature required for a passing result as the used oil, passing viscosity grade. One grade less than the new oil viscosity grade is suggested as a starting point. Report the results on Form 6 in the standardized report form set (see Annex A8).
12.6.2 Run the mini rotary viscometer test (Test Method D4684), MRV-TP1, at the recommended temperature (based on the passing used oil CCS result) using the table shown in SAE J300. Report the end-of-test mini rotary viscometer test results as MRV Temperature in degrees Celsius as follows.
12.6.2.1 If a yield stress greater than 35 Pa is obtained at the designated temperature, report the yield stress in pascals and note the apparent viscosity as not measured (NM).
12.6.2.2 If a yield stress exceeding 35 Pa is not obtained at the designated temperature, report the yield stress <35 to indicate that the yield stress did not exceed 35 Pa. Record the apparent viscosity in pascal seconds. Report the results on Form 6 in the standardized report form set (see Annex A8).
12.6.3 If the percent viscosity increase for the kinematic viscosity at EOT is higher than 500 % (see 12.7), the cold-cranking simulator and mini rotary viscometer tests are not required. A notation is required in the Other Comments and Outliers section of Form 13 (see Annex A8) indicating that the CCS and MRV were not run, and enter not measured (NM) in the standardized report form set (see Annex A8).
12.6.4 If the test oil is a straight-grade oil, the cold-cranking simulator and mini rotary viscometer tests are not required. A notation is required in the Other Comments and Outliers section of Form 13 (see AnnexA8) indicating that the CCS and MRV were not run, and enter not measured (NM) in the standardized report form set (see Annex A8).
12.6.5 If the end-of-test used oil sample fails the cold cranking simulator test at -10 °C, the mini rotary viscometer (MRV) test is not required. A notation is required in the Other Comments and Outliers section of Form 13 (see Annex A8) indicating that the MRV was not run because the EOT drain did not meet the CCS requirements -10 °C . Enter not measured (NM) in the standardized report form set (see Annex A8) for the MRV measurement.
12.7 Viscosity Test - Determine the viscosity of a sample of the fresh test oil and of the nine test samples by analysis according to the following instructions:
12.7.1 Do not filter the samples.
12.7.2 Use Test Method D445.
12.7.3 Use either the cannon-fenske routine viscometer of the Ostwald type for transparent liquids or the Cannon-Fenske opaque viscometer of the reverse-flow type for transparent and opaque liquids.
12.7.4 Conduct the measurement at 40 °C.
12.7.5 Record the results on Form 6.
12.7.6 Critically examine the relationship of the viscosity of the initial oil sample to that of the new oil. The viscosity of the initial sample can legitimately be as much as 10 mm2/s less than that of the new oil, because of permanent shearing effects. If the difference is greater than 10 mm2/s, explore possible causes such as failure to purge the oil sample line [removing the 473 mL purge sample] prior to withdrawing the 237 mL analysis sample, or an excessive amount of built-up oil in the system.
12.7.7 Calculate the change in viscosity (in millimetres squared per second) from the value for the initial sample, for the last eight samples. Record the changes on Form 6 in standardized report form set (see Annex A8). Record the final percent viscosity increase on Form 4 in standardized report form set (see Annex A8).
12.7.8 Calculation instructions for special cases related to percent viscosity increase:
12.7.8.1 Instructions for calculating and reporting results if the final original units result on Form 4 (see Annex A8) for percent viscosity increase is zero or negative.
12.7.8.2 The minimum result that will be considered for the percent viscosity increase is 0.1 %. Substitute 0.1 % for the original unit result and complete the calculations on Form 4 (see Annex A8). A notation is required in the Other Comments and Outliers section of Form 13 (see Annex A8) indicating that the original units result has been modified for a special case.
12.7.8.3 Instructions for calculating and reporting results of the viscosity result on Form 6 (see Annex A8) for viscosity increase data is "too viscous to measure (TVTM)".
12.7.8.4 The maximum kinematic viscosity result reported will be 8000 mm2/s using either equipment noted in 12.7.3, with a tube size of 500 or less. If the measured viscosity is 8000 mm2/s using tube size 500, this will be considered the maximum reportable viscosity. Report 8000 mm2/s on Form 6 (see Annex A8) for entry in the column listed as viscosity and use this value for the calculating change and percent. (This will provide consistent TVTM data for reporting purposes and it also expands the maximum viscosity to fill the space allowed by the Data Dictionary.)
12.7.8.5 Complete the calculations on Form 4 (see Annex A8) for percent viscosity increase using the percent value for the final drain from Form 6 except that the severity adjustment (SA) displayed and used for percent viscosity increase calculations will be set to zero (0). A notation is required in the Other Comments and Outliers section of Form 13 (see Annex A8) indicating that the SAhas been modified for a special case.
12.7.9 For the calculations listed in the following sections 12.7.10, 12.7.10.1, 12.7.10.2, 12.7.10.3, 12.7.10.4, and 12.7.10.5, the minimum result that will be considered for the percent viscosity increase is 0.1 %. When negative or zero percent viscosity increase results are encountered, substitute 0.1 % for the original unit result and complete the calculations. A notation is required in the Other Comments and Outliers section of Form 13 (see Annex A8) indicating that the percent viscosity result used for interpolation has been modified for a special case.
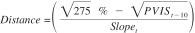
12.7.10 Determine the slope of percent viscosity increase beginning at the interval of 30 h to 40 h and continuing to calculate at 10 h intervals using the following equation:
where:
t = time in hours (40, 50, 60, 70, 80), and
PVIS = Percent Viscosity Increase at denoted hour.
12.7.10.1 Ifa reference oil test obtains an end of test percent viscosity increase results of 275 % or greater, convert to Hours to 275 % Viscosity Increase by following Method 1:
(1) Determine the distance in hours from where 275 % viscosity increase occurs to the previous 10 h interval:
where:
t = the 10 h increment hour that is greater than where the 275 % Viscosity Increase occurs or hour 80 if the 275 % Viscosity Increase occurs at end of test.
(2) Calculate Hours to 275 % Viscosity Increase as:
Hours to 275 % Viscosity Increase = (t - 10) + Distance
where:
t - 10 < the hour where 275 % Viscosity Increase occurred ≤ t.
12.7.10.2 If a reference oil test obtains a Slope t < 0.000 before 70 h, convert to Hours to 275 % Viscosity Increase using the following Method 2 unless Method 1 criteria is met:
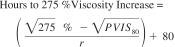
where:
r = the larger of Slope80 or 0.42.
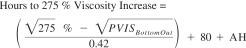
12.7.10.3 If a reference oil test obtains a Slope80 < 0.000, convert Hours to 275 % Viscosity Increase using the following Method 3 unless Method 1 criteria is met:
(1) Determine the test hours for bottom out slope of -0.15 using the following:
Additional Hours (AH) = (-0.15 - r)/-0.015
where:
r = the larger of -0.15 or Slope80.
(2) Determine percent viscosity increase at the bottom out point:

(3) Calculate Hours to 275 % Viscosity Increase as follows:
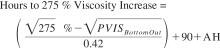
12.7.10.4 If a reference oil test does not have a negative percent viscosity increase slope (Slopet < 0.000) during any interval (30 to 40, 40 to 50, 50 to 60, 60 to 70, and 70 to 80), convert Hours to 275 % Viscosity Increase using the following Method 4 unless Method 1 criteria is met:
(1) Estimate the slope for 80 h to 90 h as follows:
Slope90 = (0.0408·ln(r)) + 0.1022
where:
ln() = the natural log, and
r = the larger of 0.002 or Slope80.
(2) Calculate the Square Root Percent Viscosity Increase at 90 h using the following:

(3) Determine additional hours to bottom out using the following:
Additional Hours (AH) = (-0.15 - r)/-0.015
where:
r = the larger of -0.15 or Slope90.
(4) Calculate new percent viscosity increase at bottom out:

(5) Calculate Hours to 275 % Viscosity Increase as follows:
12.7.10.5 For reference oil tests completing on or after June 13,2010 using reference oil 433-1, adjust the Hours to 275 % Viscosity Increase result that was calculated by the above sections by adding 10 h.
12.7.10.6 For non-reference oil tests, adjust results by performing the following steps and utilizing an industry correction factor of 10 h:
(1) Determine the interpolation point in hours for EOT viscosity increase:
Interpolation Point in Hours (IPH) = Test Length - Hours to 275 % Viscosity Increase Industry Correction Factor - Lab SA for Hours to 275 % Viscosity Increase
Or
Interpolation Point in Hours (IPH) = 80 - 10 - LabSA
(2) Find t, where t-10 < IPH ≤ t, for example, if IPH in 12.7.10.6(1) is 64.7 h, then t = 70 h and t-10 is 60 h.
(3) Calculate Final Corrected Percent Viscosity Increase by interpolation as follows:

where:
x = (t-IPH)/10, and
y = 1-x and t-10
12.9 Blowby Flow Rate Measurements - Plot blowby flow rate measurements on Form 10 in standardized report form set (see Annex A8).
12.10 Oil Consumption Computation - Compute the oil consumption for the test as follows:
12.10.1 See Note 1 of Fig.A12.1 for the oil-consumption calculation equation.
12.10.2 Determine the total fresh oil added to the engine during the initial oil leveling run and 10 h test periods in Fig.A12.1. Enter the total in the end-of-test total column on Fig.A12.1 in position a.
12.10.3 Determine the total amount of oil discarded during the 80 h test periods in Fig.A12.1. Enter the total in the end-of-test total column on Fig.A12.1 in position b.
12.10.4 Determine the computed oil level in millilitres at the end of the test in Fig.A12.1. The computed oil level is found by subtracting 708 mL from the oil level as measured on the dipstick, to account for samples not returned (236 mL oil sample and 472 mL of new oil) to the engine as in previous shutdowns. Enter the number in the end-of-test total column on Fig.A12.1 in position c.
12.10.5 Add the values determined in 12.10.2 and 12.10.4, and subtract the value determined in 12.10.3. Subtract 236 mL (the final oil sample, which is not replaced with new oil) from the value computed above. Enter the remainder, which is the amount of oil consumed in the test, in the blank for total oil consumption in the Fig.A12.1.
12.10.6 For non-reference oils, evaluate the oil consumption result based upon the following guidelines:
12.10.6.1 For oils with a stated Noack volatility that is nominally 15 % or less, the test results are considered non-interpretable for purposes of multiple test acceptance limits (MTAC) if the oil consumption exceeds 5.2 L.
12.10.6.2 For oils with a stated Noack volatility that exceeds 15 %, the test results are considered non-interpretable for purposes of MTAC, if the oil consumption exceeds 6.5 L.
12.11 Photographs of Test Parts - Take color photographs of the test parts for inclusion in the test report as follows:
12.11.1 Photograph pistons after completing all ratings.
12.11.2 Do not coat the pistons with build-up oil (for preservation) before the photographs are taken. Do not reinstall piston rings.
12.11.3 Photograph all six piston thrust sides in one shot. Piston labels are not required. (See 12.11.7.)
12.11.4 Photograph all six piston anti-thrust sides in one shot. Piston labels are not required. (See 12.11.7.)
12.11.5 Size the final piston photographs for inclusion in the test report so that the overall piston height is not less than 50 mm, but small enough that three photographs can be mounted in a column on the 280 mm dimension of a 220 mm by 280 mm sheet of paper.
12.11.6 Assemble the photographs on two pages, with the thrust side photographs on one page, and the anti-thrust photographs on the other page.
12.11.7 Mount the photographs on each of the two pages with the reciprocating axes of the pistons parallel to the 280 mm dimension of the page. Arrange the photographs in two vertical columns of three each, with the No.1 piston in the upper left corner of the page, No.2 piston in the upper right corner, No.3 piston in the center of the left column, and so forth.
12.12 Retention of Representative Test Parts - Retain for at least six months all camshafts and lifters.
12.13 Severity Adjustments - Calculate SA for results of non-reference engine oil tests. Use the control chart technique (see 12.13.1) for determining the laboratory bias for percent viscosity increase, piston skirt varnish, and WPD. Enter the adjustments on Form 4 in standardized report form set (see Annex A8).
12.13.1 The document, "The Lubricant Test Monitoring System", contains information on the Sequence IIIF Test Control Chart Technique For Developing And Applying Severity Adjustments (SA). A printed copy can be obtained from the TMC or it can be downloaded from the internet website.
12.14 Determination of Operational Validity - Determine and document the operational validity of every Sequence IIIF test conducted, according to the following:
12.14.1 Complete the report forms to substantiate that the test stand, engine build-up, installation of the engine on the test stand, and the test operation conformed to the procedures specified in this test method.
12.14.2 Inspect the test records for instances of downtime (excluding the initial oil level run of the test), and record any such instances on Form 13 in standardized report form set (see Annex A8). Enter the total downtime on Form 13, Downtime and Outlier Report Form, in standardized report form set (see Annex A8). When performing each 20 h oil level adjustment, identify as downtime any time in excess of 55 min from the time when the engine ramps down until the test is back on test operating conditions. Enter the total downtime on Form 13, Downtime and Outlier Report Form, in standardized report form set (see Annex A8). If the total downtime exceeds 24 h, note on Form 1 in standardized report form set (see Annex A8) that the test is invalid.
12.14.3 If the end of test quality-index value is below 0.000, conduct an engineering review of the test operations. The test laboratory shall conduct the engineering review of reference oil tests, and report its findings to the TMC. If needed, additional industry experts may be consulted. Document the results of the engineering review.