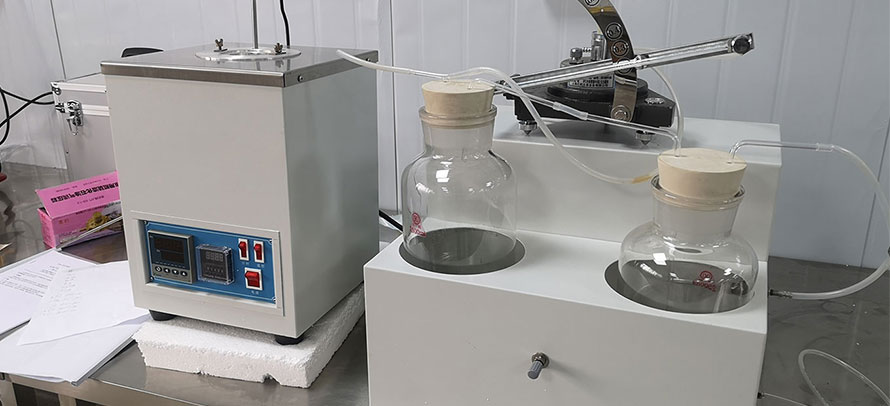
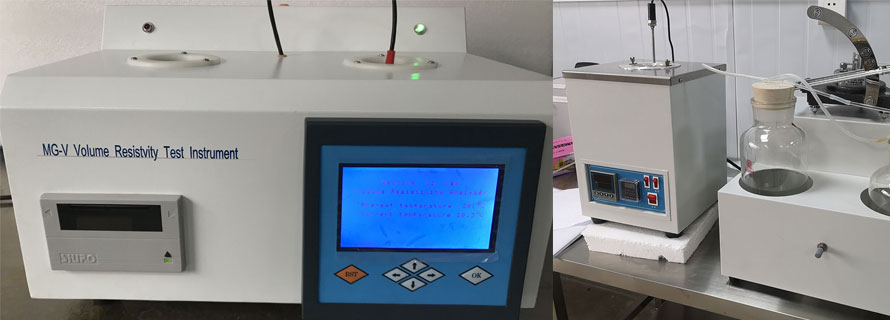
ASTM D6892 Test Method for Pour Point of Petroleum Products (Robotic Tilt Method)
12. Report
12.1 Increase the temperature recorded in 11.9 by a temperature amount equal to the testing interval used, and report the result including the testing interval as the pour point by this Test Method D6892.
NOTE 5 - Some apparatus are capable of automatically calculating and reporting these temperatures.
13. Precision and Bias
13.1 Precision - The precision of this test method as determined by statistical examination of interlaboratory test results is as follows:
13.1.1 Pour Point at 3°C Testing Intervals:
13.1.1.1 Repeatability - The difference between successive test results, obtained by the same operator using the same apparatus under constant operating conditions on identical test material, would in the long run, in the normal and correct operation ofthis test method, exceed the following, only in one case in twenty:
3.2°C
13.1.1.2 Reproducibility - The difference between two single and independent test results, obtained by different operators working in different laboratories on identical test material, would in the long run, in normal and correct operation of this test method, exceed the following, only in one case in twenty:
3.6°C
13.1.2 Pour Point at 1°C Testing Intervals:
13.1.2.1 Repeatability - The difference between successive test results, obtained by the same operator using the same apparatus under constant operating conditions on identical test material, would in the long run, in the normal and correct operation ofthis test method, exceed the following, only in one case in twenty:
1.8°C
13.1.2.2 Reproducibility - The difference between two single and independent test results, obtained by different operators working in different laboratories on identical test material, would in the long run, in normal and correct operation of this test method, exceed the following, only in one case in twenty:
2.3°C
13.2 Bias - Since there is no accepted reference material suitable for determining the bias for the procedure in this test method, bias has not been determined.
13.3 Relative Bias:
13.3.1 Pour points at 3°C testing intervals were compared to the results from Test Method D97. Relative bias among certain samples was observed. Based on the sample set used in the 1998 interlaboratory test program, the relative bias is not a fixed value but appears to be a linear function of the pour point value. Biases relative to Test Method D97 or IP 15 may conceivably occur for sample types not included in the 1998 interlaboratory test program.
NOTE 6 - For information on the bias relative to Test Method D97 or IP 15, see the research report on the interlaboratory test program.
13.3.2 Pour point results at 1°C testing intervals were examined for bias relative to the pour point results at 3°C intervals. A bias of 1.1°C on average was observed.
NOTE 7 - It shall be noted that when a specimen is tested at 1°C intervals, statistically the results will be 1°C lower than the results produced by 3°C testing intervals. This is due to test increment and reporting differences. Differences greater than 1°C over a number of samples would be from another cause. In the interlaboratory test program, the tests at 1°C intervals yielded pour points lower than those obtained from the tests at 3°C intervals by 1.1°C in average.
13.4 The precision statements were derived from a 1998 interlaboratory test program. Participants analyzed two sets of duplicate distillate diesel fuels, five sets of duplicate base oils, three sets of duplicate multigrade lubricating oils, and one set each of duplicate hydraulic oils and automatic transmission fluid in the temperature range of -51 to -11°C. Seven laboratories participated with the automatic apparatus testing at 1°C and six laboratories participated with the automatic apparatus testing at 3°C intervals, while seven laboratories participated with the manual Test Method D 97 apparatus. Information on the types of samples, and their average pour points, are available in research report RR:D02-1499.
NOTE 8 - Large differences in results were observed between methods for one sample in the 1998 interlaboratory test study. The sample was a high-sulfur winter diesel. When cooled during the performance of a test method, this sample formed thin, but very large, crystals, that could be described as large plates. These crystals formed wherever sample-glass contact was made and covered the top surface of the sample as well. The entire sample, except for this all encasing thin skin of crystals, remained liquid with apparent low viscosity. When this occurred and the sample was handled gently, the sample did not pour, but with rougher handling, the crust broke and the sample poured readily. Users of this test method are advised to be alert for differences in results between test methods when this behavior is observed in the sample being tested.
14. Keywords
14.1 automatic pour point; petroleum products; pour point; robotic tilt method

