ASTM D6584 Test Method for Determination of Free and Total Glycerin in B-100 Biodiesel Methyl Esters By Gas Chromatography
8. Preparation of Apparatus
8.1 Install and condition the column in accordance with manufacturer or supplier's instructions. After conditioning, attach column outlet to flame ionization detector inlet and check for leaks throughout the system. If leaks are found, tighten or replace fittings and recheck for leaks before proceeding.
9. Calibration and Standardization
9.1 Preparation of Calibration Standards - Prepare standards using fresh compounds listed in Table 2 according to Practice D4307. Weigh the components directly into the volumetric flasks specified and record the mass to the nearest 0.1 mg. Dilute the volumetric flasks to mark with pyridine. Store the calibration standards in a refrigerator when not in use.
9.2 Standard Solutions - Prepare the five standard solutions in Table 3 by transferring the specified volumes by means of microlitre syringes to 10 mL septa vials. Add to each of the five standard solutions 100 µL of MSTFA. Close the vial and shake. Allow the vial to stand for 15 to 20 min at room temperature. Add approximately 8 mL n-Heptane to the vial and shake.
9.3 Chromatographic Analysis - If using an automatic sampler, transfer an aliquot of the solution into a glass GC vial and seal with a TFE-fluorocarbonlined cap.
9.4 Standardization:
9.5 Analyze the calibration standards under the same operating conditions as the sample solutions. Inject 1 µL of the reaction mixture into the cool on-column injection port and start the analysis. Obtain a chromatogram and peak integration report. For each reference substance, determine the response ratio (rspi) and amount ratio (amti) for each component using Eq 1 and 2
rspi = (Ai/As)
where:
Ai = area of reference substance, and
As = area of internal standard.
amti = (Wi/Ws)
where:
Wi = mass of reference substance, and
Ws = mass of internal standard.
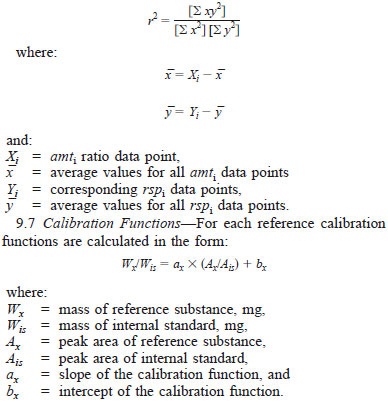
Prepare a calibration curve for each reference component by plotting the response ratios (rspi), as the y-axis, versus the amount ratios (amti), as the x-axis.
9.6 Calculate the correlation coefficient r2 value for each reference component in the calibration set using Eq 3. The r2 value should be at least 0.99 or greater. If the above criteria for r2 are not met, rerun the calibration or check instrument parameters and hardware.