8. Sampling
8.1 Use the principles of Practice D4057 in acquisition of test sample(s).
8.2 Precautions must be taken to shield the samples from sunlight prior to analysis.
NOTE 5 - Studies have shown that exposure to direct sunlight will show a decrease in dye concentration over time.
9. Calibration and Standardization
9.1 Preparation of Stock Standard:
9.1.1 Solvent Red 26 - Weigh approximately 0.0750 g of the dye standard to the nearest 0.1 mg on an analytical balance, quantitatively transfer the dye to a 250 mL volumetric flask, and dilute to mark with xylene. Mix the prepared solution thoroughly.
9.1.2 Determine the exact concentration of dye in the stock standard using the following equation:

where:
C = concentration of active dye ingredient in the stock standard, mg/L,
M = mass of certified dye standard used in preparing the stock standard, g, and
P = purity of certified dye standard used in preparing the stock standard, purity %/100, for example, for a 99.0 % Solvent Red 26 material, P = 0.99.
9.1.3 Store the stock standard in tightly capped/sealed brown glass bottles and store in a dark place when not in use to prevent deterioration.
9.2 Preparation of Working Calibration Standards:
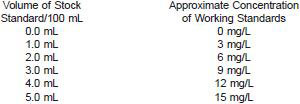
9.2.1 Pipet the volumes of the stock standard specified below into separate 100 mL volumetric flasks and dilute to volume with kerosine.

9.2.2 Determine the exact concentration of dye in each working standard using the following equation:

where:
Cs = concentration of each working standard, mg/L,
V = volume of stock standard, mL, and
Cm = concentration of active dye in stock standard, mg/L.
9.2.3 Store the working calibration standards in tightly capped/sealed brown glass bottles and store in a dark place when not in use to prevent deterioration.
9.3 Using a clean 1.0 cm sample cell, scan each of the working standards against air (empty reference sample compartment) from 450 nm to 750 nm, recording the absorbance for each using a scan rate of 120 nm/min, maximum data recording interval of 0.11 nm, and a maximum slit width of 1.0 nm.
NOTE 6 - Other instrument conditions may be used if they can be demonstrated to give equivalent results to this test method (see Note 2).
9.4 Using derivative analysis software, calculate and plot the second derivative spectra for each standard over this wavelength range using an instrument noise level dampening setting of sufficient level to provide a smooth second derivative curve.
9.5 Measure the amplitude difference for the maximum and minimum listed below:

NOTE 7 - Specific amplitude units employed will vary, depending on instrumentation or software used, or both.

