ASTM D2622 standard test method for sulfur in petroleum products by wavelength dispersive X-ray fluorescence spectrometry
9. Calibration
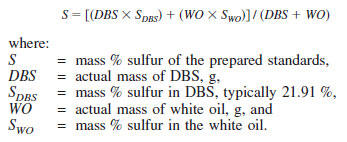
9.1 Prepare calibration standards by careful mass dilution of the certified di-n-butyl sulfide with a sulfur-free white oil or other suitable base material (see 7.5). The concentrations of the unknown samples must lie within the calibration range that is used. Approximate recommended nominal sulfur concentration standards are listed in Table 2 for the sulfur concentration ranges of interest. Take into account any sulfur in the base material when calculating the concentration of standards below 0.02 mass % (200 mg/kg), as shown in Eq 1:
NOTE 8 - If desired, additional standards can prepared and analyzed with concentrations between those listed in Table 2, see 9.1.1.
9.1.1 Calibration standards can also be prepared by careful mixing of certified reference materials (CRM) of the same matrix, so long as the sulfur values of the resulting blends and their uncertainties are characterized by the certifying body.
9.1.2 Alternatively, standards may be prepared by mass serial dilution of polysulfide oils (Note 5) with sulfur-free white oil. A freshly prepared polysulfide oil calibration curve should be verified using CRM's traceable to a national measurement institution that has demonstrated proficiency for measuring sulfur in the matrix of interest. Once a polysulfide oil calibration curve is established, the calibration standards are stored at room temperature, out of direct sunlight, and in amber glass bottles. Polysulfide oil standards can be prepared over a wide concentration range from low ppm to high weight percent levels of sulfur. They are easily prepared in quantity and make excellent quality control standards. Shaking polysulfide oil standards before fresh aliquots are taken is recommended to ensure the standard is uniformly blended. The high molecular weight of these sulfur compounds results in a very low vapor pressure that inhibits X-ray film diffusion. Therefore, an autosampler can be employed during the measurement process. Calibration curves prepared from polysulfide oils demonstrate excellent linearity and help the analyst visualize the full dynamic range of their analytical method.
NOTE 9 - Commercially available standards can be used provided their sulfur concentrations are accurately known and they approximate the nominal concentrations listed in Table 2.
9.2 Establish calibration curve data by carefully determining the net intensity of the emitted sulfur radiation from each of the standards by the procedures described in Sections 10 and 11.
9.2.1 Standards containing 100 mg/kg total sulfur or less must be analyzed in duplicate. Either both of the individual values or the average value of these measurements can be used in the calibration. All samples in this sulfur concentration range must also be analyzed in duplicate, as in 10.12, and reported as in 12.1.1.
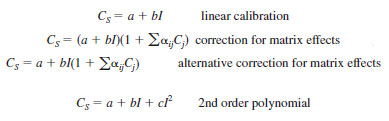
9.3 Construct a calibration model by using the software and algorithms supplied by the equipment vendor. The calibration model typically takes one of the following forms (refer to the equipment vendor's software documentation to determine the exact form):
where:
CS = mass fraction of sulfur. The concentration units depend on the fitted calibration constants a, b and c,
I = measured net intensity for the sulfur radiation,
a = fitted calibration line offset (intercept),
b = fitted calibration line slope,
c = fitted calibration line 2nd order polynomial,
aij = correction factor for the effect of an interfering element (j) on sulfur (i). The interfering element can be sulfur when "matrix eliminated alphas" or empirical corrections are used, and
Cj = concentration of the interfering element (j).
NOTE 10 - The aij factors can be determined empirically through multiple regression, or theoretically through fundamental parameters. Equipment vendors typically have provisions in their software for calculating theoretical a's.
9.3.1 Fit the calibration data over several ranges if necessary, depending on the sulfur concentrations to be covered. For example (Table 2): 0 to 0.10 mass % sulfur, 0.10 to 1.0 mass % sulfur, and 1.0 to 5.0 mass % sulfur.
NOTE 11 - Calibration curves are typically linear to about 0.10 mass % sulfur. The analyst should choose a linear calibration model when fitting within this range. One of the other calibration models (correction for matrix effects or a 2nd order polynominal) should be chosen when fitting to higher concentrations of sulfur.
9.4 When using drift correction monitors, determine the intensity of the drift correction monitor sample(s) during the calibration procedure. The value determined corresponds to the factor A in Eq 7 in 11.1.
9.5 Immediately after completing the calibration, determine the sulfur concentration of one or more of the calibration check samples (7.10). The differences between two measured values shall be within the repeatability of this test method (see 14.1.1). When this is not the case, the stability of the instrument and the repeatability of the sample preparation are suspect and corrective measures should be taken. The degree of matrix mismatch between samples and standards should also be considered when evaluating a calibration. Statistical quality control charts may be prepared for these materials to establish if the method is in statistical control, as described in Section 13.