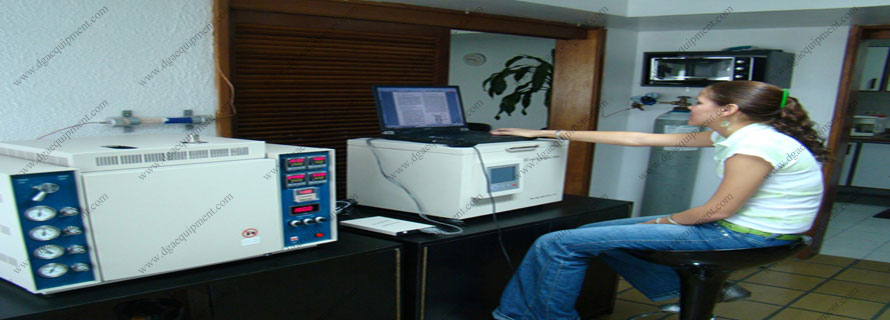
Determine oxidation stability of steam turbine oils by rotating pressure vessel
10. Quality Control Monitoring
10.1 The performance of the equipment should be confirmed by analyzing quality control (QC) sample(s).
10.2 Prior to monitoring the measurement process, determine the average value and control limits for the QC sample.
10.3 Record QC results and analyze by control charts or other statistically equivalent techniques to ascertain the statistical control status of the total test process. Investigate any out of control data for root cause(s).
10.4 The frequency of QC testing is dependent on the criticality of the measurement, the demonstrated stability of the testing process, and customer requirements. The QC sample testing precision should be periodically checked against the expected test precision to ensure data quality.
10.5 It is recommended that, if possible, the type of QC sample that is regularly tested be representative of the samples routinely analyzed. An amply supply of QC sample material should be available for the intended period of use and shall be homogenous and stable under the anticipated storage conditions.
10.6 See Practice D 6299 and MNL 7 for further guidance on quality control monitoring.
11. Report
11.1 Interpretation of Results
11.1.1 Observe the plot of the recorded pressure versus time and establish the maximum pressure (see Note 7). Record the time at the point on the falling part of the curve where the pressure is 175 kPa (25.4 psi, 1.75 bar) less than the maximum pressure. If the test is repeated, the maximum pressures in repeat tests should not differ by more than 35 kPa (5.1 psi, 0.35 bar).
11.2 Report the Results
11.2.1 The life of the sample is the time in minutes from the start of the test to a 175 kPa (25.4 psi, 1.75 bar) pressure drop from the maximum pressure.
11.2.2 Report the method used: Method A or Method B.
11.2.3 If requested, and if a sharp change in pressure is observed, report the time to break in minutes.
NOTE 8 - In reporting test results, it is recommended that it be indicated whether tests were made with stainless steel or chrome-plate copper vessels.
12. Precision and Bias
12.1 The precision and bias statement is generated from the research report (95 % confidence). The data range of results in the research report is from 100 to over 3000 min.
12.1.1 Repeatability - The difference between successive test results obtained by the same operator with the same apparatus under constant operating conditions on identical test material, would in the long run, in the normal and correct operation of the test method, exceed the following values only in one case in twenty:
Repeatability = 0.22 (X + 31)
where:
X = denotes mean value.
12.1.2 Reproducibility - The difference between two single and independent results obtained by different operators working in different laboratories on identical test material, would in the long run, in the normal and correct operation of the test method, exceed the following values only in one case in twenty:
Reproducibility = 0.39 (X + 31)
where:
X = denotes mean value.
NOTE 9 - This precision statement was prepared with data on eight oils (Group I-IV base stocks) tested by eight cooperators. The oils covered values in the ranges from 100 to over 3000 min.
12.2 Bias - There being no criteria for measuring bias in these test-product combinations, no statement of bias can be made.


